
How does openinstall optimize App operation
- 2025.08.18 12:00
- openinstall
- Scenario Analysis
Peter Drucker, the father of modern management, advocated using management to drive business growth. He famously said: “If you can’t measure it, you can’t improve it.”
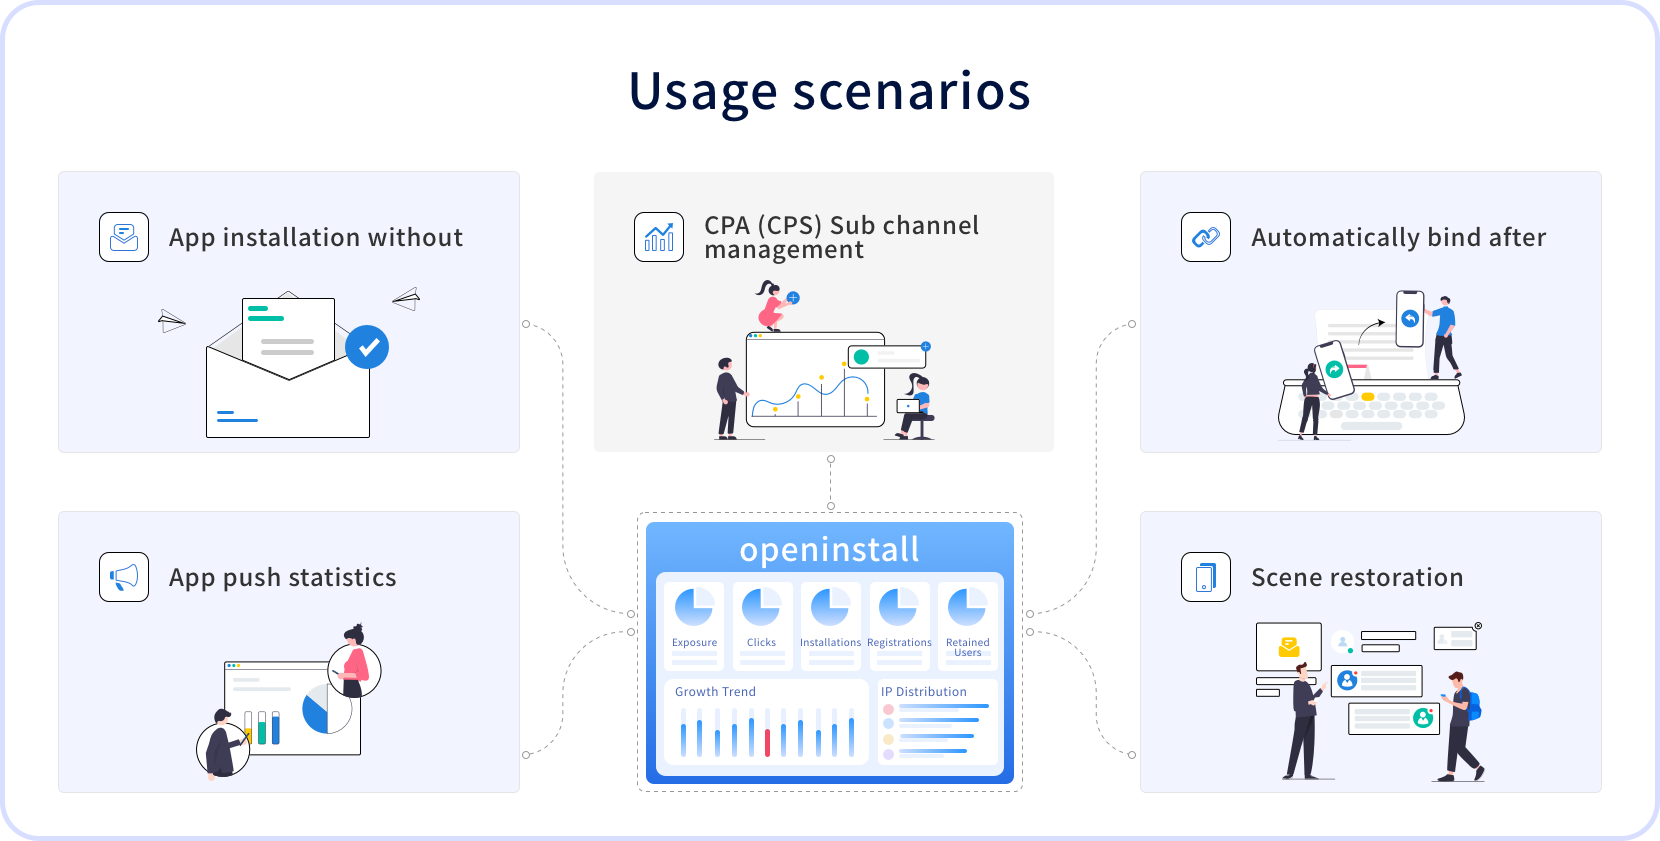
Similarly, to measure the effectiveness of App promotion and user engagement, scientific data analytics is essential. openinstall, a professional omnichannel analytics tool, provides robust support for App operations.

What is App Analytics?
App analytics involves collecting and analyzing user data during App usage to understand behavior, evaluate operational outcomes, and optimize product experience. This data helps answer questions like:
- How many new users downloaded and used the App?
- Which features are most popular?
- Which stages cause user churn?
- Which channels bring higher-quality users?
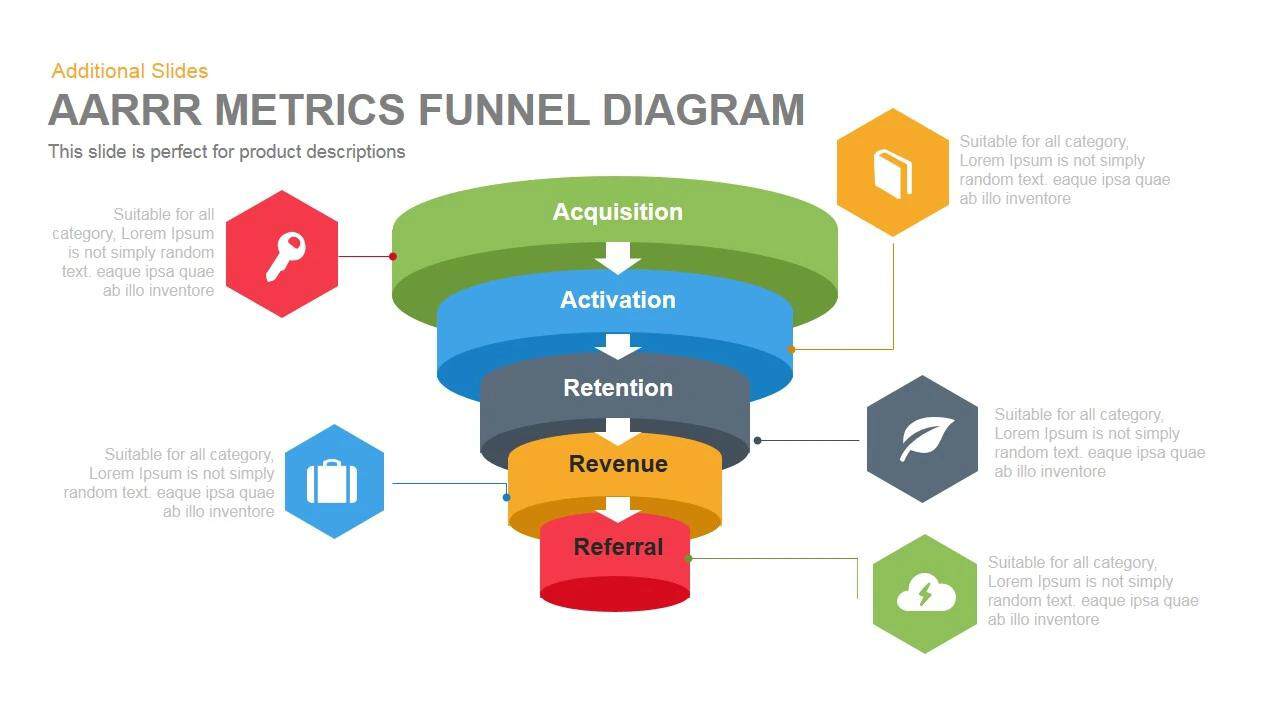
Think of it as a fishpond: Data metrics are the net that determines success:
- User Acquisition: Daily New Users
- User Engagement & Value: Activation Rate
- User Health Analysis: Retention Rate
1. Daily New Users: The Source of Fresh Water
This metric counts first-time users per day, reflecting growth momentum. Without new users, the user pool dries up. It directly measures marketing effectiveness.
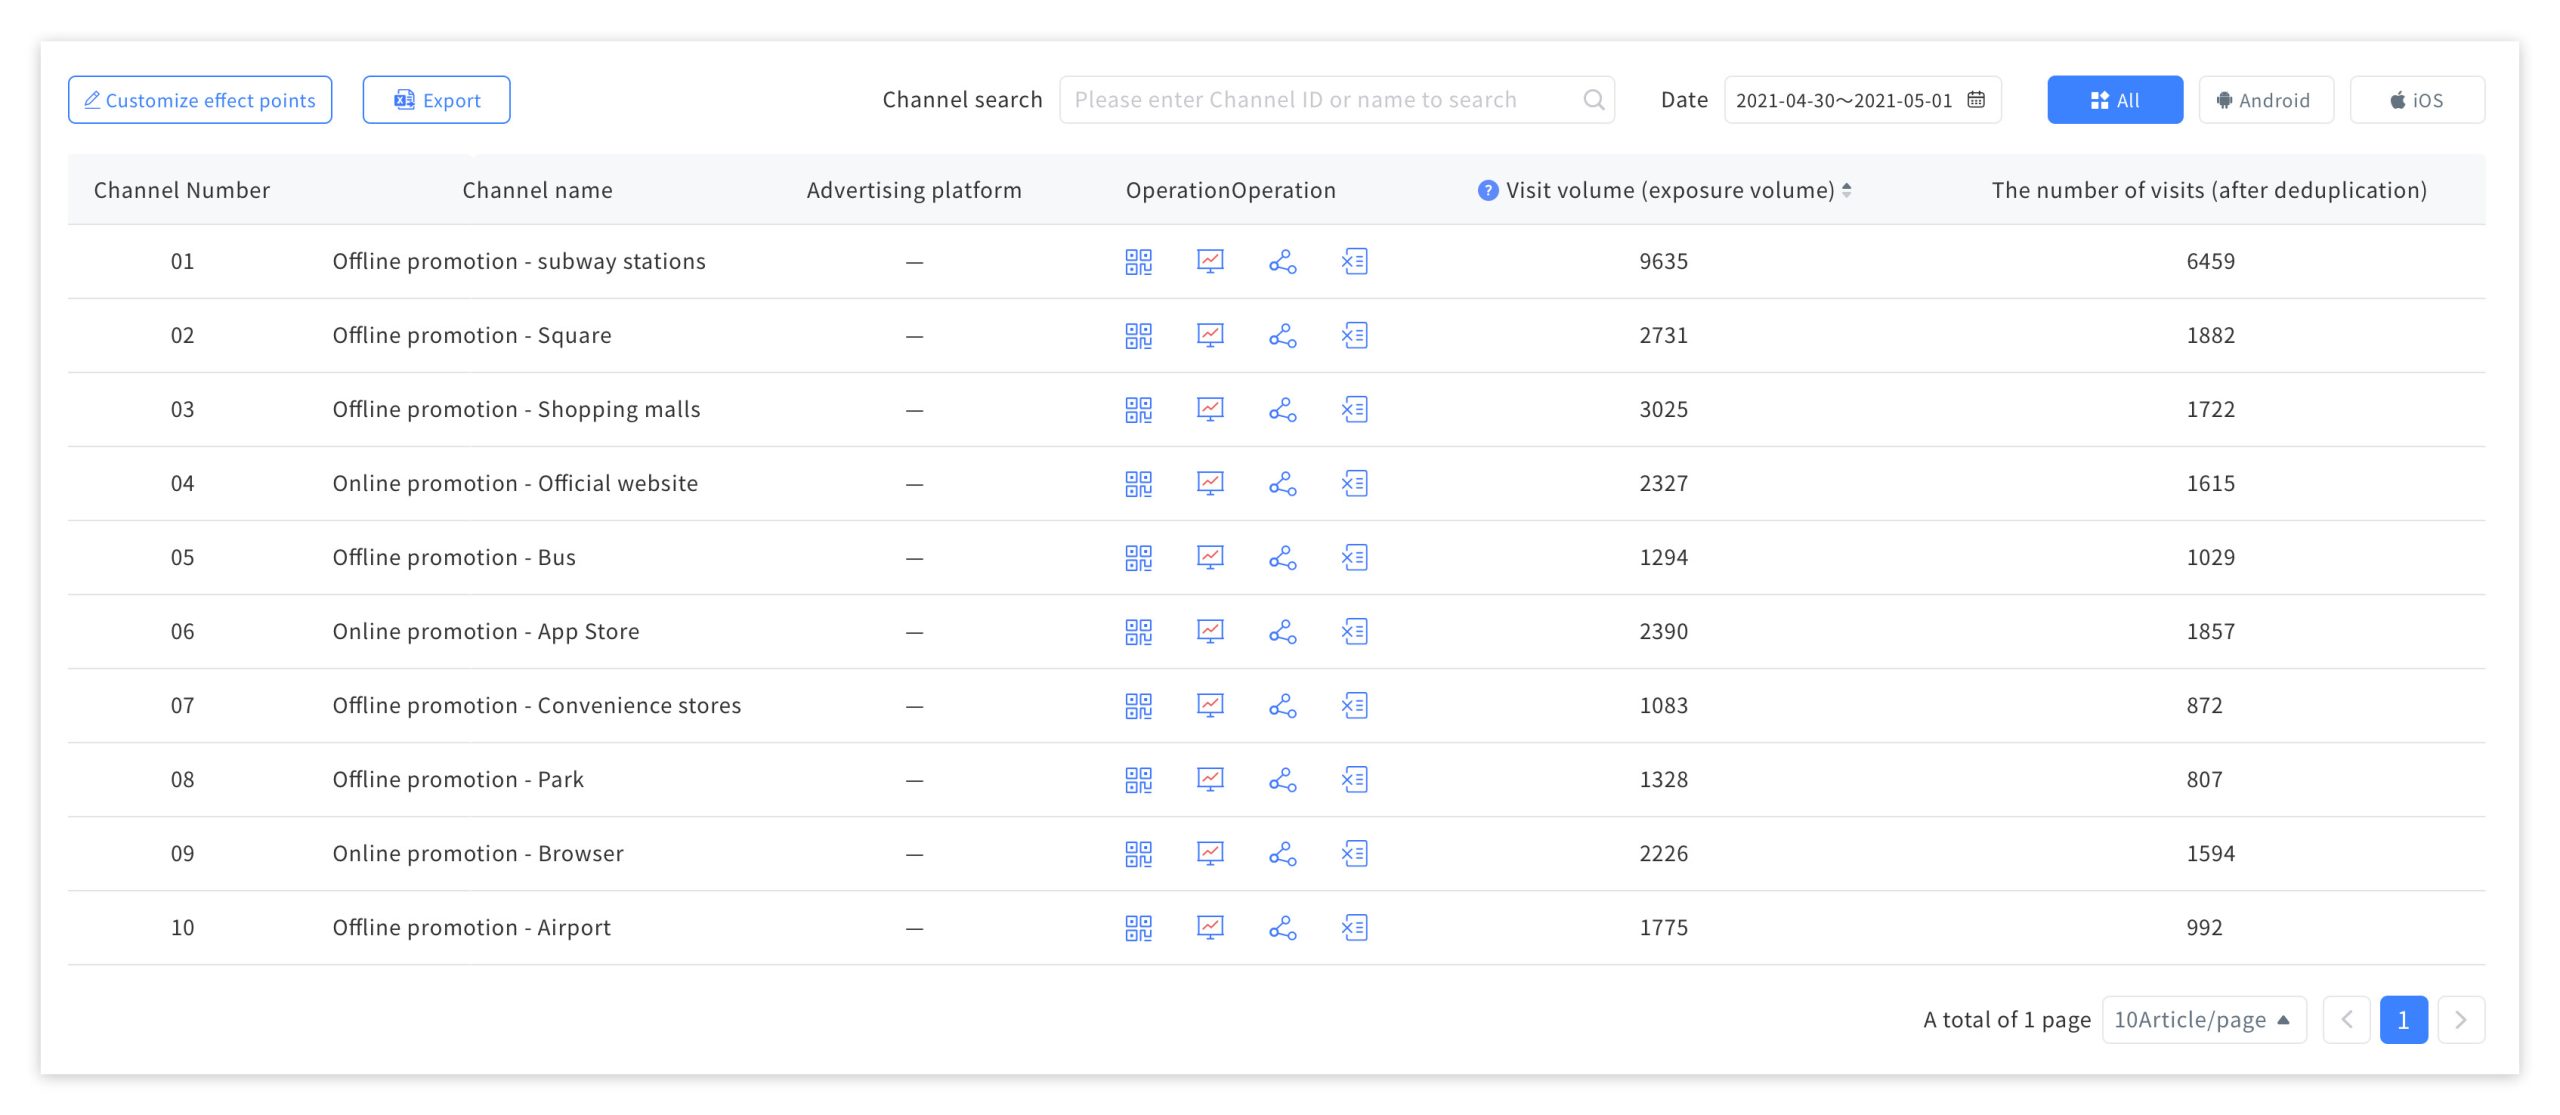
Key Focus: Channel Analysis,New user volume varies greatly across channels (e.g., social ads, KOL campaigns, offline promotions, user sharing).
openinstall’s Solutions:
Precise Channel Attribution: Solves “where users come from.” Tracks installs from online ads, QR codes, social shares, or offline posters, generating detailed channel reports.
Channel ROI Evaluation: Shows user volume and quality per channel (combined with retention analysis), optimizing budget allocation and phasing out low-performing channels.
Cross-Platform Attribution: Unifies data across platforms, eliminating “data black holes” and providing a consistent user-source view.
2. Activation Rate: The Vitality Metric
Active users as a percentage of total users (DAU/WAU/MAU). Core: Clearly define “active” (e.g., opening the App, completing key actions).
This reflects product stickiness and daily value. High activation = habitual usage. Note: Deduplicate counts (one user = one active user).
openinstall’s Solutions:
Enhance New User Activation: Uses Deep Links + Deferred Deep Linking to send users directly to personalized pages (e.g., promotions, products) post-install, shortening conversion paths and boosting first-time engagement.
Precision Engagement Strategies: Tracks activation trends, growth, and user cohorts. Combines behavioral data to refine channel-specific strategies (e.g., targeted offers/content). All metrics support deduplication and advanced filtering.
3. Retention Rate: Key to Stickiness & Health
The percentage of Day 1 users still active on Day N (e.g., D1/D7/D30). Measures long-term value and user retention. Low retention signals churn—investigate causes. *Reference: Facebook’s 40-20-10 Rule (D1 40%, D7 20%, D30 10%)*.
openinstall’s Solutions:
Channel Quality Assessment: Retention-integrated reports reveal which channels bring “loyal fish” (high retention) vs. “passers-by” (low retention). Optimize channels for quality users.
Improve User Onboarding: Deep Linking delivers personalized content/features at first launch, meeting user expectations and boosting D1/D7 retention.
Conclusion
Measure to grow. Precision to excel. By mastering these metrics and leveraging openinstall’s error-free attribution + seamless Deep Linking, developers turn data into sustainable product vitality and market advantage.

Recent Posts
- Runway Launches MCP Server? Ecosystem Shift Re-maps Paths
- Qualcomm Bytedance ASIC Deal? Distribution Shift Re-maps Traffic
- Microsoft Pauses Vibe Coding? Traffic Bubble Forces Growth Restructuring
- Google Redefines Search Box? Distribution Shift Triggers Crisis
- OpenAI Project Daybreak? Fraud Risks Expose Vulnerability
- Figure Robot Runs Autonomously? Attribution Crisis Looms
- Tencent Open Sources Agent Memory? Distribution Shift Alters Rules
- OpenAI Mobile Codex? Distribution Shift Triggers Crisis
- Musk Dissolves xAI Company? Capital Frenzy Alters Digital Ecosystem
- Tech Giants Launch ATH Protocol? Compliance Wall Blocks Bots